You’re seeing steady 6–8% annual growth in mixer grinder demand across India, with South and West leading ownership and mid-tier models (₹3,500–7,000) growing fastest. Durability, energy-efficient brushless motors, safety and 3–5 year warranties now shape purchases, while 62% of shoppers begin online and rely on reviews and service signals to convert. There’s more—how these trends reshape brand strategies and retail mix matters next.
Key Takeaways
- Market size ~₹8,500–9,500 crore in 2025 with 6–8% YoY growth, strongest volume gains in South and West India.
- Durability, energy efficiency and ISI/BIS certification dominate purchase decisions for 64–72% of buyers.
- Mid-tier segment (₹3,500–7,000) is fastest-growing, gaining ~34% YoY share; premium demand rises in metros.
- Buyers research online (62%) but 44% complete purchase after in-store demos; verified reviews and warranty pages boost conversions.
- After-sales (2–5 year warranties, 48-hour doorstep service, transparent spare-part pricing) strongly influence repurchase and trust.
Market Size, Growth and Regional Sales Patterns
How big is the mixer-grinder market in India today, and where is growth concentrated? You’re looking at a ~INR 8,500–9,500 crore market in 2025, up ~6–8% year-on-year, driven by Tier-2/Tier-3 urbanization and affordable electrification. Volume growth is strongest in South and West India, where per-household ownership rose 4–6% last year; North and East show steady, slower gains. Premium segments grow 10–12% in metros, while entry-level units dominate hinterlands. Offline retail still accounts for ~65% of sales, but e-commerce share has climbed to ~28%, accelerating during festive quarters. Supply chains tightened early 2024, then stabilized, improving safety compliance and reducing defective rates by ~2 percentage points. Forecasts show sustained moderate growth, concentrated in smaller cities and digital channels. Commercial demand increasingly favors higher-wattage motors and durable, serviceable designs for hotel and small-business use.
Consumer Priorities: Features Driving Purchases in 2025
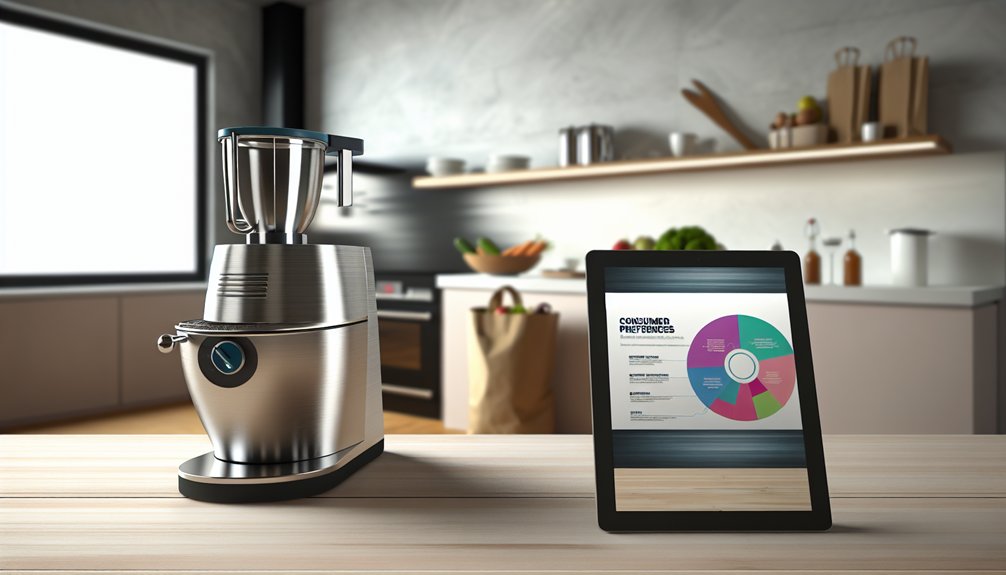
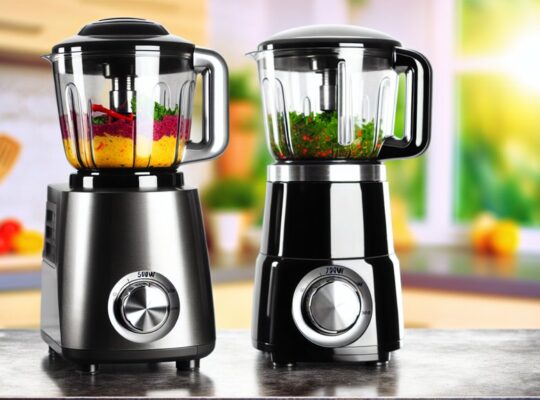
Why are buyers prioritizing durability and energy efficiency more than ever? You’re seeing survey data: 72% of urban buyers and 64% of rural buyers rank long motor life and low-watt consumption as top purchase drivers in 2025. Safety features—thermal overload protection, auto-shutoff, and leak-resistant seals—are cited by 58% as deal-breakers. Noise reduction and stable body design appear in 45% of purchase decisions, reflecting household safety and comfort concerns. Warranty length correlates with perceived reliability; models with 3–5 year warranties capture 38% higher consideration. Price sensitivity remains, but not at the expense of certified safety standards (ISI/BIS), which 81% expect. Higher-wattage motors (≈750W) and adequate torque ratings help sustain performance with tougher ingredients and reduce the risk of motor stall.
Technological and Design Innovations Shaping Models
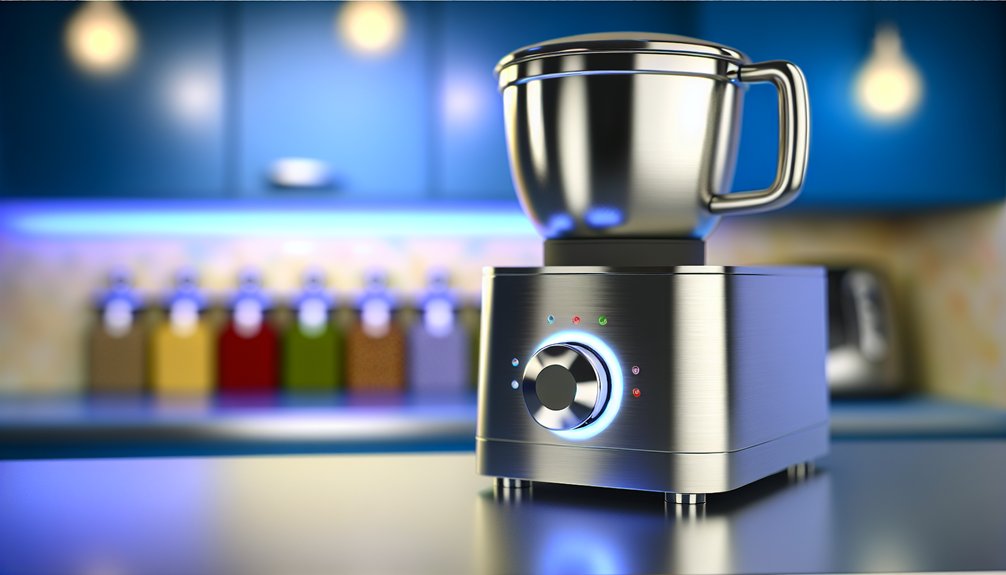
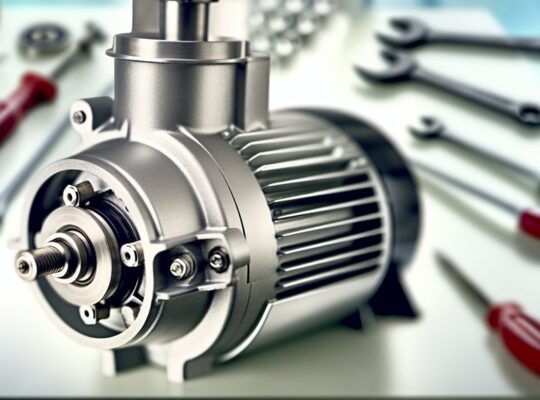
What’s changing in 2025 is less about gimmicks and more about measurable gains: manufacturers are integrating brushless DC motors, smart energy-management circuits, and composite noise-dampening enclosures to meet the rising demand for longer motor life and lower watt consumption. You’ll see torque-optimized impellers that reduce stall risk by up to 30% and electronic thermal cutoffs that lower overheating incidents substantially. Sensors enable load-adaptive speed control, cutting energy use during light tasks by ~20%. Food-grade, BPA-free jar linings and sealed bearings minimize contamination and maintenance risk. Modular designs simplify part replacement, improving serviceability metrics. Regulatory-driven safety features — auto-shutoff on lid misalignment and insulated wiring paths — are increasingly standard, aligning performance gains with user protection. Manufacturers are also emphasizing proper dry grinding practices and jar-care guidance to extend appliance life and ensure safe, consistent results.
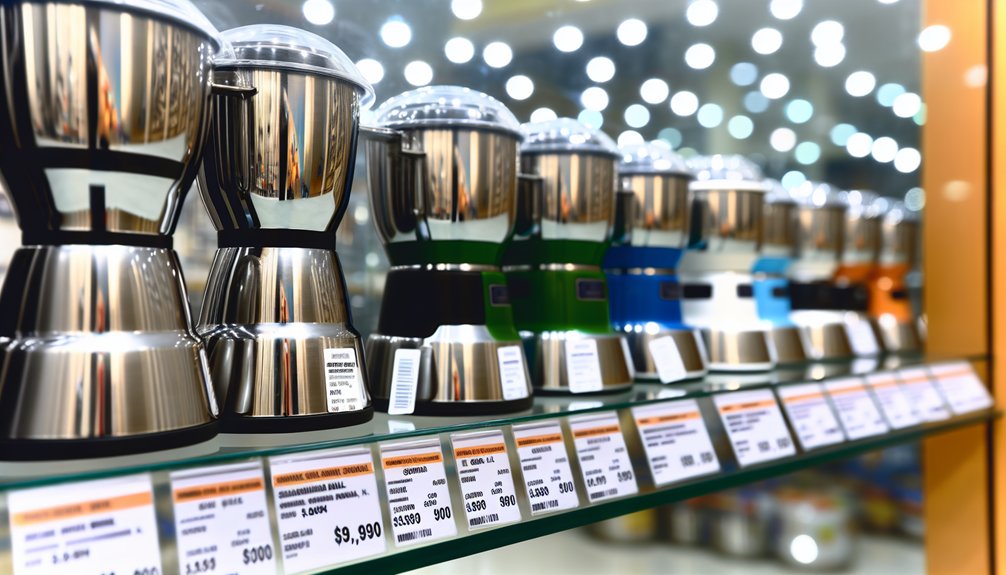
Price Segments, After‑Sales and Brand Trust Dynamics
Curious where shoppers are putting their money in 2025? You’re seeing clear stratification: value (₹1,500–3,500) still captures volume-conscious buyers, mid (₹3,500–7,000) grows fastest with 34% YoY share gain, and premium (₹7,000+) edges up as aspirational safety features sell. After‑sales performance now drives purchase decisions—brands promising 2–5 year warranties, prompt doorstep service within 48 hours, and digitized service tracking report 21% higher repurchase intent. Trust metrics correlate with transparent spare-part pricing, published uptime statistics, and verified service-center density per 100k households. You’ll favor brands that publish incident response times and have independent third‑party service audits. For safety-minded buyers, these measurable guarantees reduce perceived risk and shorten decision cycles, shifting spending toward accountable manufacturers. Manufacturers with widely available service networks and proven product durability — such as models noted for reliable motor performance — gain a clear market advantage.
Retail Channels, E‑commerce Trends and Purchase Journeys
Where are buyers starting their mixer-grinder journeys in 2025? You’re increasingly beginning online: 62% research on e‑commerce platforms, social commerce and short videos before visiting stores. Hybrid journeys dominate—44% move from online discovery to in‑store demo for safety checks like build quality and noise levels. Trust signals matter: verified reviews, seller ratings and clear warranty pages lift conversion by 28%. Marketplace sales grow 18% year‑on‑-year, while brand-owned sites convert higher-value purchases due to bundled service assurances. Contactless delivery and extended return windows reduce purchase anxiety; 71% cite these as decisive. Rural adoption rises via vernacular listings and regional logistics. For safer choices, you’ll follow verified specs, warranty verification and post‑sale service maps before buying. Prioritizing models with overload protection and clear motor warranties reduces long-term ownership risks.
Frequently Asked Questions
Are Mixer Grinders Energy-Efficient Compared to Standalone Appliances?
Yes, they often are—combining functions reduces cumulative power draw versus multiple standalone units. You’ll save electricity and space if you choose high-efficiency motors, inverter-compatible models, and use appropriate jars for task-specific loads to minimize waste.
Which Models Are Best for Traditional Grinding Like Idli/Dosa Batter?
You should pick wet‑grind models like Preethi Zodiac, Philips HL series, or Bajaj Rex with stainless steel jars and powerful motors (500–750W); they trend for consistent batter texture, overload protection, and safety features like thermal cutoff.
Do Any Brands Offer Buy-Back or Recyclable Appliance Programs?
Yes — several major brands now offer buy-back or recycling schemes; you’ll find documented returns, exchange credits, and authorized e-waste pickups. Prioritize certified programs with traceable disposal data and safety-compliant refurbishing to minimize hazard risk.
What Are Typical Warranty Claim Turnaround Times Nationwide?
Nationwide warranty claim turnaround typically ranges 3–10 business days for repair, 7–14 days for part replacements, and 10–30 days for unit exchanges; you’ll want registered purchase and proper documentation to ensure these timelines are met.
How Noisy Are Mixer Grinders During Heavy-Duty Use?
They’re typically loud during heavy-duty use, often reaching 85–95 dB; newer models trend lower (75–85 dB) with better insulation. You should use hearing protection for prolonged use and prefer models specifying noise ratings and safety features.